


2021 THIRD QUARTER HIGHLIGHTS
- Sales of $5,719.8 million, down 2.0%, and up 9.4% vs 2019
- Food same-store sales down 3.6%, and up 11.4% vs 2019
- Pharmacy same-store sales up 7.6%, and up 8.6% vs 2019
- Net earnings of $252.4 million, down 4.2% and adjusted net earnings(1) of $261.2 million, down 4.1%
- Fully diluted net earnings per share of $1.03, down 1.0%, and adjusted fully diluted net earnings per share(1) of $1.06, down 1.9%
- Expenses related to COVID-19 totalling $38 million, including $8 million of gift cards to front-line employees
- Transition to new Ontario fresh distribution center completed, adding $8 million of non-recurring costs
PRESIDENT’S MESSAGE
“We are pleased with the solid results of our third quarter considering we cycled exceptionally strong sales and earnings last year at the height of the pandemic. Our sales and earnings growth over 2019 levels is strong. Despite the challenging operating environment caused by the pandemic, our teams successfully completed three key strategic initiatives during the quarter: the transition to our new automated Fresh distribution center in Toronto; the integration of our pharmacy distribution operations into the Jean Coutu distribution center in Varennes; and the opening of our dedicated store for online grocery in Montréal. These achievements position us well to meet our growth objectives going forward“, declared Eric La Flèche, President and Chief Executive Officer.
OPERATING RESULTS
SALES
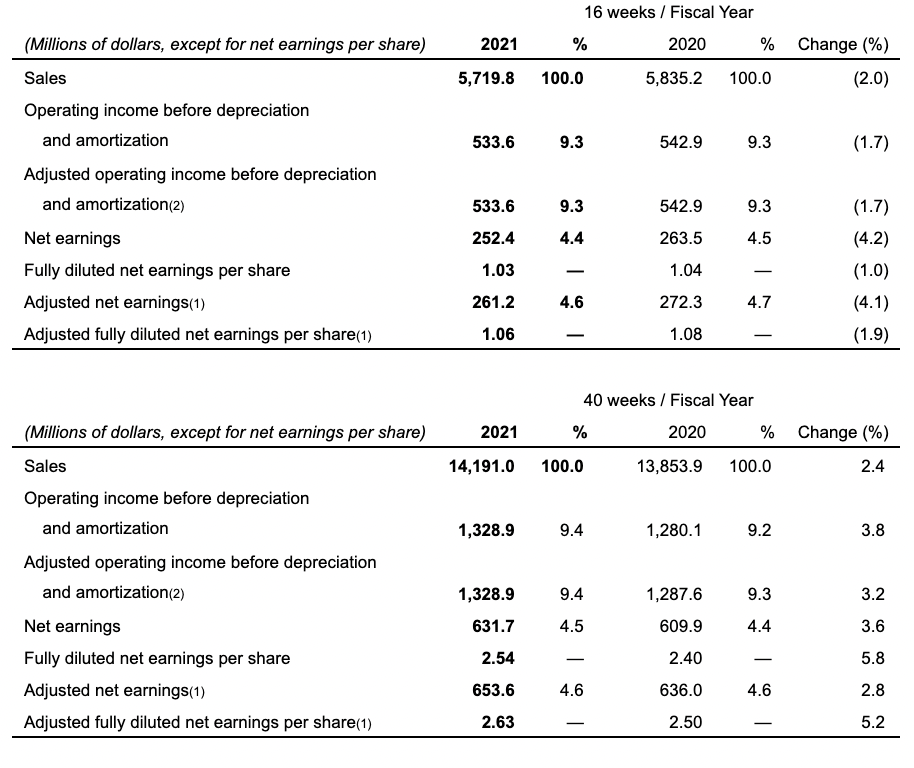
Sales in the third quarter of Fiscal 2021 remained strong, reaching $5,719.8 million, down 2.0% compared to $5,835.2 million in the third quarter of 2020 as we cycled the peak sales experienced at the start of the pandemic but up 9.4% over two years. Food same-store sales were down 3.6% versus the same quarter last year (up 15.6% in 2020) but increased 11.4% compared to the third quarter of 2019. Online food sales increased by 19% versus last year (about 300% in 2020). Our food basket inflation was approximately 1.0% (3.0% in 2020). Pharmacy same-store sales were up 7.6% (1.0% in 2020), with a 9.3% increase in prescription drugs and a 3.8% increase in front-store sales.
Sales in the first 40 weeks of Fiscal 2021 totalled $14,191.0 million, up 2.4% compared to $13,853.9 million for the corresponding period of 2020.
OPERATING INCOME BEFORE DEPRECIATION AND AMORTIZATION
This earnings measurement excludes financial costs, taxes, depreciation and amortization.
Operating income before depreciation and amortization for the third quarter of Fiscal 2021 totalled $533.6 million, or 9.3% of sales, down 1.7% versus the corresponding quarter of last year.
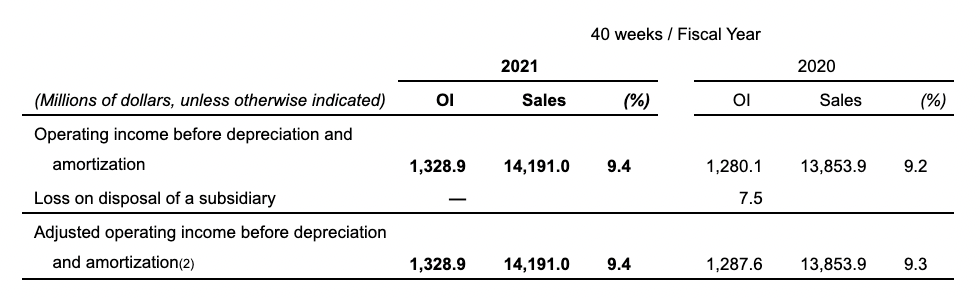
Operating income before depreciation and amortization for the first 40 weeks of Fiscal 2021 totalled $1,328.9 million or 9.4% of sales, up 3.8% versus the corresponding period of 2020. During the first 40 weeks of Fiscal 2020, we recognized a loss of $7.5 million on disposal of our meal-kit subsidiary. Excluding this item, adjusted operating income before depreciation and amortization(2) for the first 40 weeks of Fiscal 2021 increased by 3.2% versus the corresponding period of 2020.
Operating income before depreciation and amortization adjustments (OI)(2)
Gross margin on sales for the third quarter and the first 40 weeks of Fiscal 2021 were 19.8% and 19.9% respectively, versus 20.0% and 19.8% for the corresponding periods of 2020.
Operating expenses as a percentage of sales for the third quarter of Fiscal 2021 were 10.5% versus 10.7% for the corresponding quarter of 2020. COVID-19 related expenses for the third quarter of Fiscal 2021 were approximately $38 million, including $8 million of gift cards to front-line employees, versus approximately $107 million in the same quarter last year. This decrease of $69 million was partly offset by an increase in other operating expenses, mainly related to activities and services that have been reinstated after initially being halted at the start of the pandemic, and non-recurring costs of approximately $8 million related to the transition to our new fresh distribution center in Ontario.
For the first 40 weeks of Fiscal 2021, operating expenses as a percentage of sales were 10.5% versus 10.6% (10.5% excluding the loss on disposal of our meal-kit subsidiary) for the corresponding period of 2020. The costs related to COVID-19 for the first 40 weeks of Fiscal 2021 were approximately $95 million, including $24 million of gift cards to front-line employees, compared to $110 million in 2020.
DEPRECIATION AND AMORTIZATION AND NET FINANCIAL COSTS
Total depreciation and amortization expense for the third quarter of Fiscal 2021 was $149.4 million versus $140.5 million for the corresponding quarter of 2020. For the first 40 weeks of Fiscal 2021, total depreciation and amortization expense was $367.5 million versus $344.0 million for the corresponding period of 2020. These increases reflect the additional investments in supply chain and logistics as well as in-store technology.
Net financial costs for the third quarter of Fiscal 2021 were $42.1 million compared with $43.0 million for the corresponding quarter of 2020. For the first 40 weeks of Fiscal 2021, net financial costs were $104.8 million compared with $106.0 million for the corresponding period of 2020.
INCOME TAXES
The income tax expense of $89.7 million for the third quarter of Fiscal 2021 represented an effective tax rate of 26.2% compared with an income tax expense of $95.9 million in the third quarter of Fiscal 2020 which represented an effective tax rate of 26.7%. The 40-week period income tax expense of $224.9 million for Fiscal 2021 and $220.2 million for Fiscal 2020 represented an effective tax rate of 26.3% and 26.5% respectively.
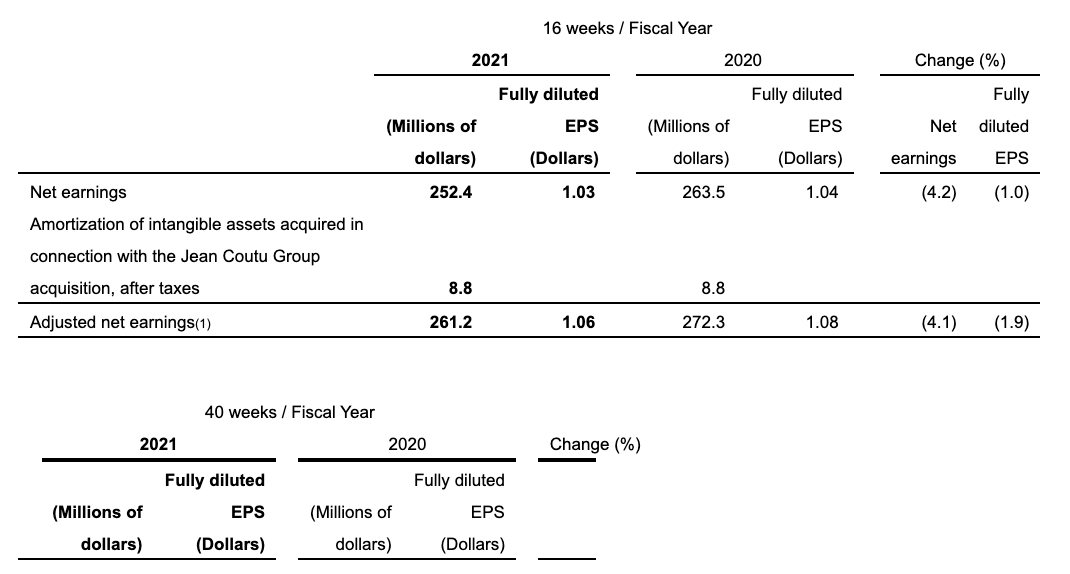
NET EARNINGS AND ADJUSTED NET EARNINGS(1)
Net earnings for the third quarter of Fiscal 2021 were $252.4 million compared with $263.5 million for the corresponding quarter of 2020, while fully diluted net earnings per share were $1.03 compared with $1.04 in 2020, down 4.2% and 1.0%, respectively but up 13.5% and 19.8% respectively on a two-year basis. Excluding the specific items shown in the table below, adjusted net earnings(1) for the third quarter of Fiscal 2021 totalled $261.2 million compared with $272.3 million for the corresponding quarter of 2020, and adjusted fully diluted net earnings per share(1) amounted to $1.06 versus $1.08, down 4.1% and 1.9%, respectively but up 13.4% and 17.8% respectively over two years.
Net earnings for the first 40 weeks of Fiscal 2021 were $631.7 million compared with $609.9 million for the corresponding period of 2020, while fully diluted net earnings per share were $2.54 compared with $2.40 in 2020, up 3.6% and 5.8%, respectively. Excluding the specific items shown in the table below, adjusted net earnings(1) for the first 40 weeks of Fiscal 2021 totalled $653.6 million compared with $636.0 million for the corresponding period of 2020, and adjusted fully diluted net earnings per share(1) amounted to $2.63 versus $2.50, up 2.8% and 5.2%, respectively. The impact of the labour conflict at the Jean Coutu distribution center in the first quarter of Fiscal 2021, was approximately $0.05 per share.
Net earnings adjustments(1)