


The company reported its financial results for the fourth quarter and full-year periods ending December 31, 2021. All amounts are expressed in U.S. dollars unless indicated otherwise and are prepared under U.S. Generally Accepted Accounting Principles (GAAP).
Fourth Quarter 2021 Financial Highlights
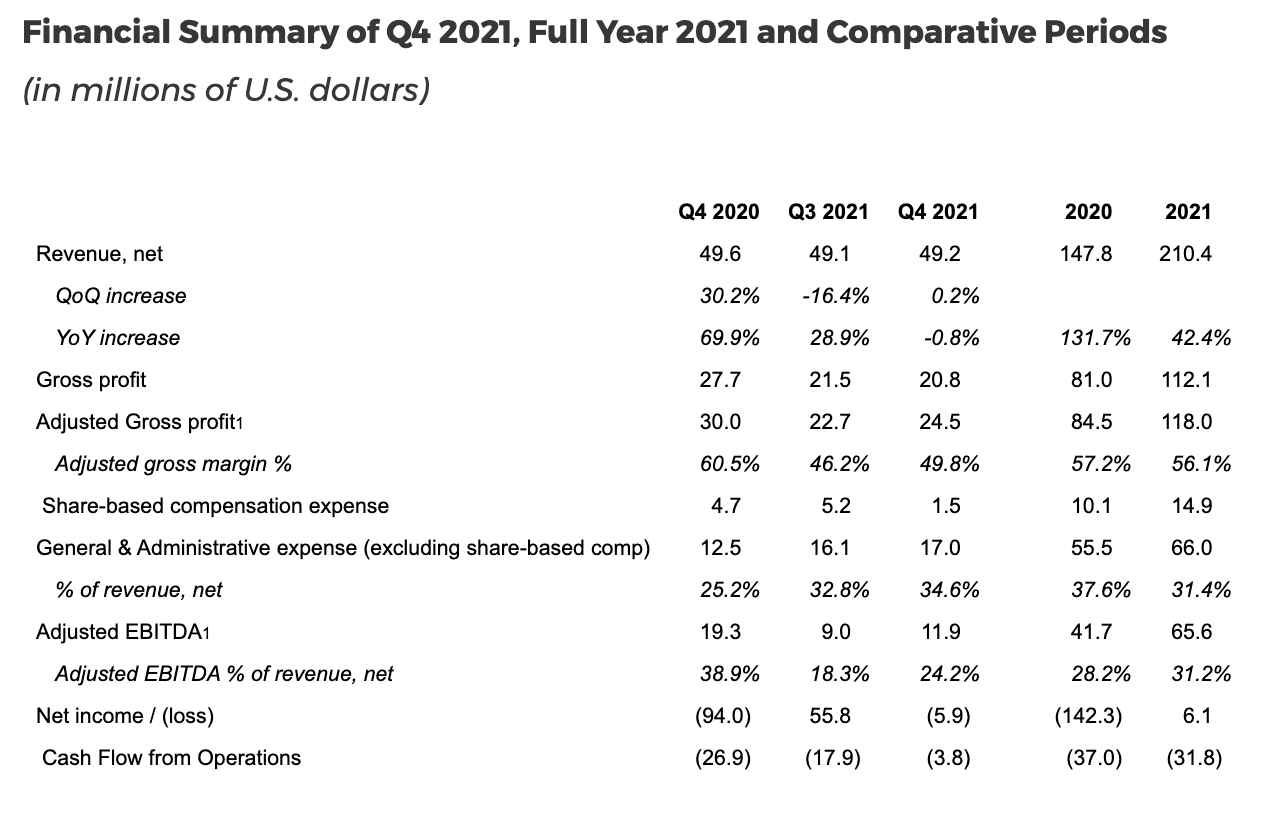
- Net Sales were $49.2 million as compared to $49.1 million in Q3 2021 and $49.6 million in Q4 2020.
- Gross Profit Margin was 42.3% as compared to 43.8% in Q3 2021 and 55.8% in Q4 2020.
- Adjusted Gross Profit Margin1 was 49.8% as compared to 46.2% in Q3 2021 and 60.5% in Q4 2020.
- Adjusted EBITDA1 was $11.9 million as compared to $9.0 million in Q3 2021 and $19.3 million in Q4 2020. Adjusted EBITDA under IFRS, excluding lease expense, was $12.8 million as compared to $10.5 million in Q3 2021.
- Adjusted EBITDA Margin1 was 24.2% as compared to 18.3% in Q3 2021 and 38.9% in Q4 2020.
- Cash and cash equivalents totalled $79.6 million as of December 31, 2021.
The full Year 2021 Financial Highlights
- Net Sales were $210.4 million, an increase of 42% year-over-year.
- Gross Profit Margin was 53.3% compared to 54.8% in 2020.
- Adjusted Gross Profit Margin1 was 56.1% compared to 57.2% in 2020.
- Adjusted EBITDA1 of $65.6 million compared to $41.7 million in 2020, an increase of 57% year-over-year. Adjusted EBITDA under IFRS, excluding lease expense, was $70.1 million as compared to $45.5 million in 2020.
- Adjusted EBITDA Margin1 of 31.2% compared to 28.2% in 2020, an expansion of 300 basis points.
Jason Wild, Executive Chairman of TerrAscend, commented, “The strategic decisions we made in Pennsylvania have resulted in the highest quality product we have ever sold in this market. Additionally, the actions undertaken in New Jersey have our team prepared for adult use, where we have one of the largest cultivation footprints in the state, along with three ideal dispensary locations. Furthermore, I am thrilled that we have recently completed our acquisition of Gage, which provides us with a leadership position in yet another multi-billion market and the ability to launch this brand beyond Michigan. I’m proud of the hard work by the team in 2021, which has us well-positioned for the explosive growth we expect in 2022 and beyond.”
Fourth Quarter 2021 Business and Operational Highlights
- Pennsylvania facility producing the highest quality product to date; recapturing top 3 market share for the month of December 2021.2
- New Jersey wholesale and retail fully prepared for adult use, pending regulatory approval.
- Closed on the purchase of a 156,000 square foot facility in Hagerstown, MD for expansion of cultivation and processing, which is expected to be operational during the third quarter of 2022.
- Completed US GAAP conversion and became a US filer under SEC.
Subsequent Events
- Closed on the acquisition of Gage Growth Corp.
- Appointed Ziad Ghanem as President and Chief Operating Officer.
- Appointed Jared Anderson, SVP Finance & Strategy; Charishma Kothari, SVP Marketing and Charles Oster, SVP Sales.
- Appointed Kara DioGuardi to the Board of Directors.
- Became the first major MSO to expand its e-commerce platform via proprietary Apothecarium mobile app, available in the Apple App store, with express pick-up and delivery where permitted.
| 1. Adjusted EBITDA and the respective margin and Adjusted Gross Profit and the respective margin are non-GAAP measures. Please see discussion and reconciliation of non-GAAP measures at the end of this press release. |
| 2. According to Headset Data for the period December 1, 2021, through December 26, 2021. |
Full Year and Fourth Quarter 2021 Financial Results
Net sales for the full year 2021 totalled $210.4 million as compared to $147.8 million for 2020, an increase of 42% primarily driven by the Company’s first complete year in the New Jersey medical market and retail growth in Pennsylvania, reflecting the acquisition of KCR in May of 2021, as well as a full year of operations at the three existing Apothecarium dispensaries. Total revenue also benefitted from the late 2020 expansion of State Flower cultivation in California and entry into Maryland through the acquisition of HMS Health in May of 2021.
Net sales for the fourth quarter of 2021 were $49.2 million as compared to $49.1 million for the third quarter of 2021 and $49.6 million for the fourth quarter of 2020.
Gross margin for the full year 2021 was 53.3% as compared to 54.8% for the full year 2020. Adjusted gross margin, a non-GAAP financial measure, for the full year 2021 was 56.1% compared with 57.2% in 2020 driven by second half under-absorption related to the reset of the Company’s Pennsylvania
Gross margin for the fourth quarter of 2021 was 42.3% as compared to 43.8% in the third quarter of 2021 related to one-time non-cash write-downs of inventory in Canada and a step up in the fair value of inventory related to the acquisition of HMS Health. Adjusted gross margin for the fourth quarter of 2021, excluding these one-time items, was 49.8% as compared to 46.2% for the third quarter of 2021, a 360 basis point improvement quarter-over-quarter.
General & Administrative expenses (G&A) for the full year 2021, excluding stock-based compensation, improved to 31.4% of revenue versus 37.6% of revenue in 2020. G&A excluding stock-based compensation was $66.0 million in 2021, up from $55.5 million in 2020 driven by increased personnel expenses to support the growth of the business and legal expenses primarily related to acquisitions and settlements. Additionally, lease expense, now part of G&A under US GAAP across all periods, rather than previously being reported as finance expense under IFRS, totalled $4.5 million for 2021 and $3.8 million for 2020, representing approximately 2% of revenue.
G&A, excluding stock-based compensation, for the fourth quarter of 2021 totalled $17.0 million as compared to $16.1 million for the third quarter of 2021 with the increase primarily related to an increase in professional fees for US filer and GAAP conversion work.
Full-year 2021 adjusted EBITDA was $65.6 million, or $70.1 million excluding lease expense under IFRS, versus $41.7 million, or $45.5 million excluding lease expense under IFRS in 2020, representing 57% growth year over year. 2021 adjusted EBITDA margin was 31.2% versus 28.2% in 2020, a 300 basis point improvement year over year. This improvement was driven by the ramp-up of New Jersey operations, the acquisition of HMS in Maryland, and profitability improvements year over year in both California and Canada.
Fourth-quarter 2021 adjusted EBITDA was $11.9 million, representing a 24.2% adjusted EBITDA margin, as compared to $9.0 million and an 18.3% margin in the third quarter of 2021. This sequential improvement in adjusted EBITDA was primarily driven by growth in New Jersey and improvement in Pennsylvania. Adjusted EBITDA, excluding lease expense under IFRS, was $12.8 million in the fourth quarter of 2021 as compared to $10.5 million in the third quarter of 2021.
Operating income for the full year 2021 totalled $23.5 million as compared to $9.6 million in full-year 2020, representing an increase of 145% year over year. The increase was primarily driven by the scale-up of the New Jersey business and the acquisitions of HMS in Maryland and KCR in PA.
Fourth-quarter 2021 operating income was $0.3 million as compared to a loss of $1.8 million for the third quarter of 2021. The improvement quarter over quarter was due to gross margin expansion and lower share-based compensation expense.
Net income for the full year 2021 totalled $6.1 million, mainly related to a non-cash $58 million gain on the fair value of warrant liability compared with a net loss of $142 million in the prior year, which was impacted by a non-cash $110 million loss on the fair value of warrant liability.
Net loss in the fourth quarter was $5.9 million, mainly related to a one-time loss of $3.3 million in lease termination fees, $6.9 million of finance and other expenses, $6.9 million of accrued income taxes, and $2.0 million of transaction costs mostly related to the Gage acquisition. These expenses were partially offset by a $14.4 million non-cash gain on the fair value of warrant liability.
Balance Sheet and Cash Flow
Cash and cash equivalents were $79.6 million as of December 31, 2021, compared to $102.6 million as of September 30, 2021, and $59.2 million as of December 31, 2020, providing ample capacity to fund planned organic and inorganic growth initiatives. During the quarter, the Company made the final payment of $25 million related to the partial buyout of its New Jersey partnership, taking ownership up to 87.5%, from 75%.
Cash used in operations was $3.8 million for the three months ended December 31, 2021, mainly driven by an increase in inventory related to the anticipated start of adult-use sales in New Jersey. For the full year, cash used in operations was $32 million related to a $24 million working capital increase, mainly related to preparation for New Jersey adult use, and a contingent consideration payment of $11 million.
Capital expenditures were $11.8 million in the fourth quarter of 2021 primarily related to capacity expansions at the Pennsylvania and Maryland
As of March 15, 2022, there were 318.2 million basic shares outstanding including 251.8 million common shares, 14.0 million preferred shares as converted, and 52.4 million exchangeable shares, including both Canopy and Gage exchangeable shares.
Financial results and analyses are available on the Company’s website (www.terrascend.com) and SEDAR (www.sedar.com).
The Canadian Securities Exchange (“CSE”) has neither approved nor disapproved the contents of this news release. Neither the CSE nor its Market Regulator (as that term is defined in the policies of the CSE) accepts responsibility for the adequacy or accuracy of this release.
Definition and Reconciliation of Non-GAAP Measures
In addition to reporting the financial results in accordance with GAAP, the Company reports certain financial results that differ from what is reported under GAAP. Non-GAAP measures used by management do not have any standardized meaning prescribed by GAAP and may not be comparable to similar measures presented by other companies. The Company believes that certain investors and analysts use these measures to measure a company’s ability to meet other payment obligations or as a common measurement to value companies in the cannabis industry, and the Company calculates Adjusted Gross Profit as Gross Profit adjusted for certain material non-cash items and Adjusted EBITDA as EBITDA adjusted for certain material non-cash items and certain other adjustments management believes are not reflective of the ongoing operations and performance. Such information is intended to provide additional information and should not be considered in isolation or as a substitute for measures of performance prepared in accordance with GAAP. The Company believes this definition is a useful measure to assess the performance of the Company as it provides more meaningful operating results by excluding the effects of expenses that are not reflective of the Company’s underlying business performance and other one-time or non-recurring expenses.
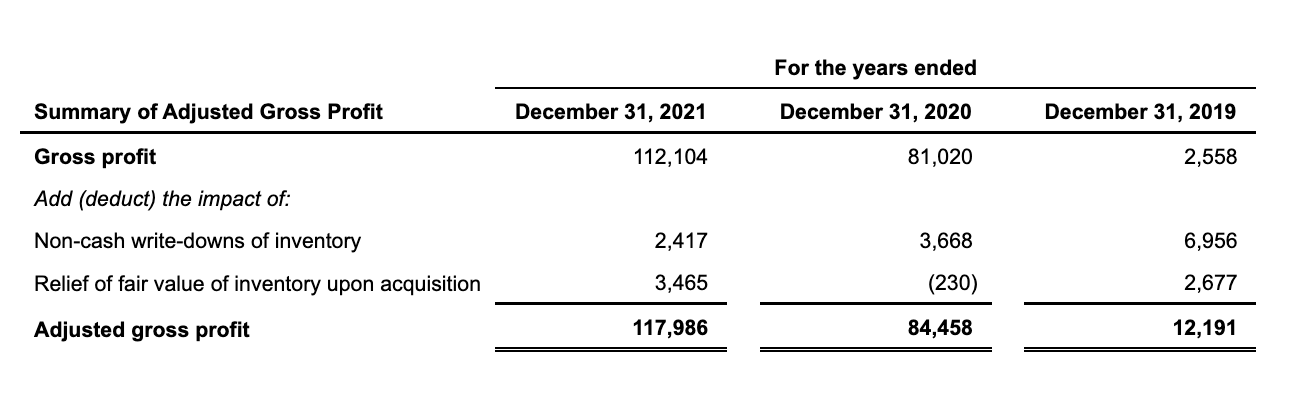
The table below reconciles Gross Profit and Adjusted Gross Profit for the years ended December 31, 2021, December 31, 2020, and December 31, 2019.
(in millions of U.S. Dollars)
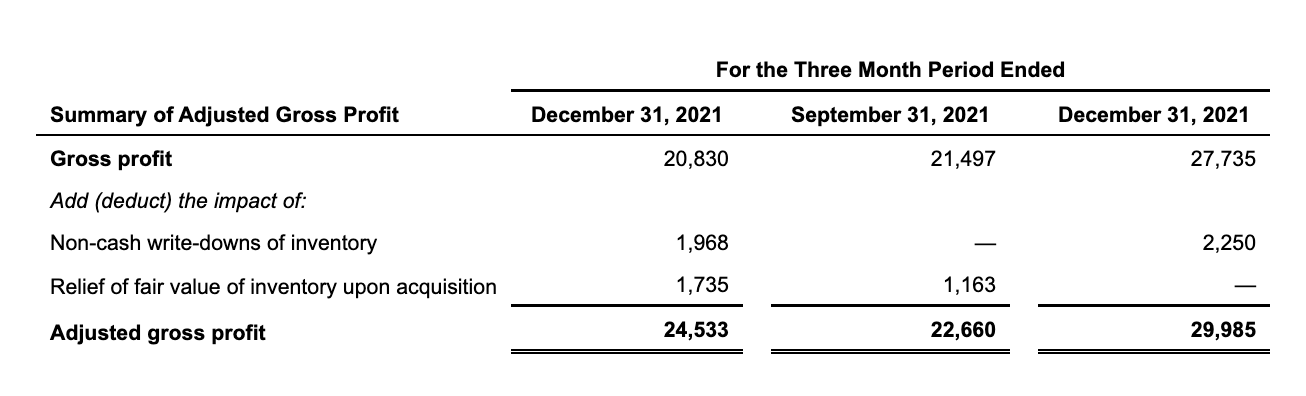
The table below reconciles Gross Profit and Adjusted Gross Profit for the three months ended December 31, 2021, September 30, 2021 and December 31, 2020.
(in millions of U.S. Dollars)
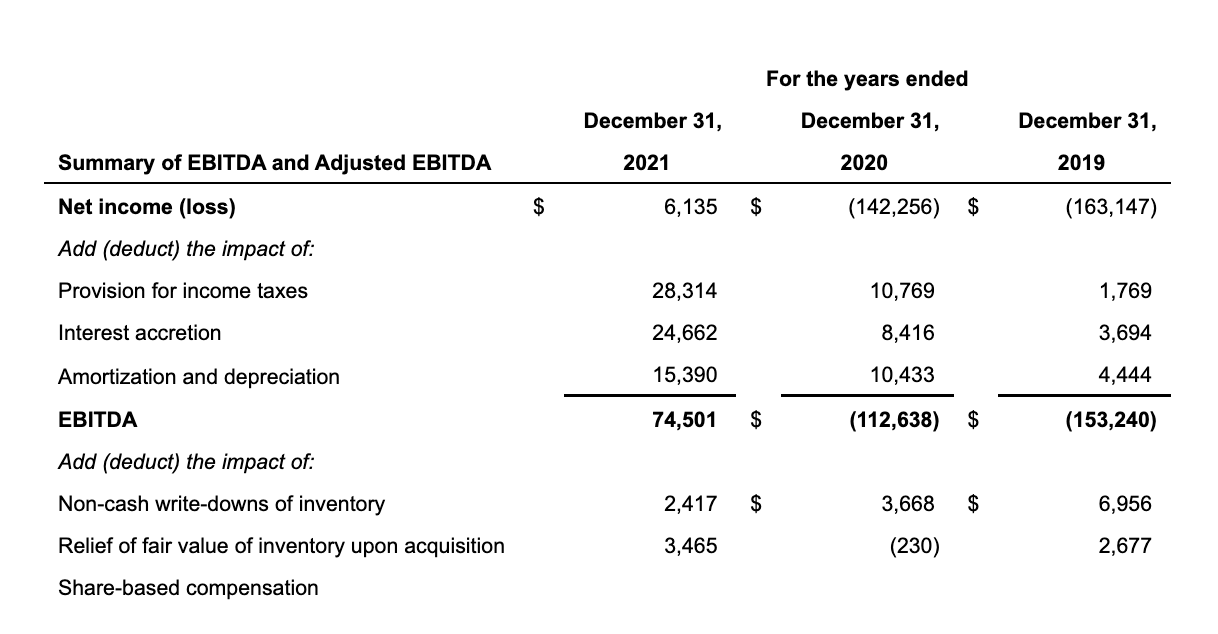
The table below reconciles net income (loss) to EBITDA and Adjusted EBITDA for the years ended December 31, 2021, December 31, 2020, and December 31, 2019.
(in millions of U.S. Dollars)